pkb contents > performance management | just under 3725 words | updated 12/27/2017
Organizational performance, according to Jones and George (2015), consists of:
Per Terwiesch (n.d.), strategy and assessment often reference four operational dimensions, between which there may be a trade-off:
The trade-off curve can be estimated by locating the performance of existing companies for any two dimensions; then, the question is whether your company is operating on the frontier or within it.
Per Sharda et al. (2014), BPM is also called corporate performance management (CPM), enterprise performance management (EPM), strategic enterprise management (SEM), and (more narrowly) value chain management. Performance management relates to the core managerial activity of strategy in the following way (called the "closed-loop BPM cycle"; Sharda et al., 2014):
https://en.wikipedia.org/wiki/Continual_improvement_process: "Some see CIPs as a meta-process for most management systems (such as business process management, quality management, project management, and program management)"
| Strategize | Plan | Monitor/Analyze | Act/Adjust |
|---|---|---|---|
| Where do we want to go? | How do we get there? | How are we doing? | What do we need to do differently? |
|
|
|
|
Sharda et al. (2014, p. 131) cite Eckerson (2009) on the properties of KPIs:
KPIs can be classified (Sharda et al., 2014, p. 131):
Per Sharda et al. (2014, pp. 136-137), "Measures should:
Or, fundamentally: "Measures need to be derived from the corporate and business unit strategies and from an analysis of the key business processes required to achieve those strategies."
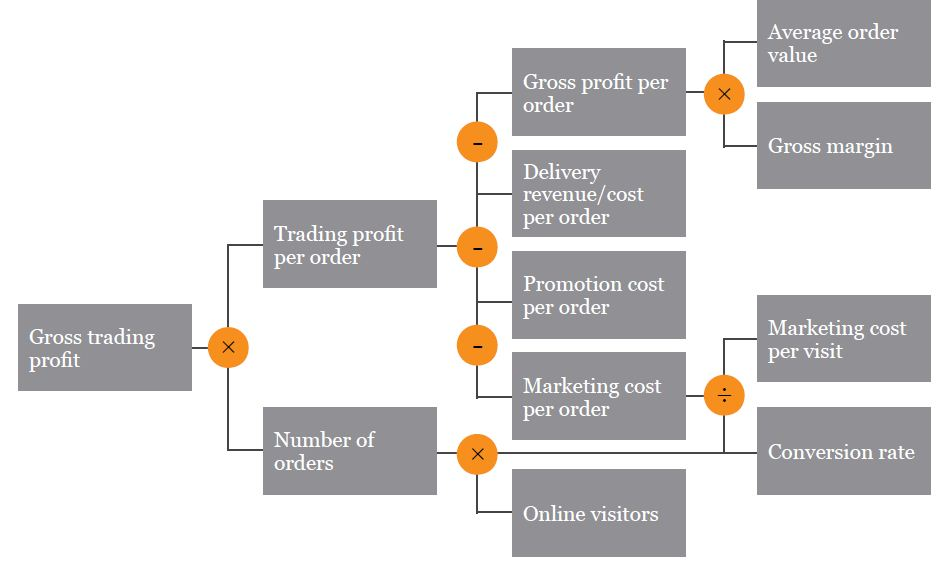
Per Terwiesch (n.d.), KPI trees are about “visualizing the relationship between operational variables and the financial bottom line, and are also the starting point for sensitivity analysis wherein we identify those operational variables that have the largest impact.” To use one, out dependencies between variables, then take the partial derivative of the terminal KPI w/r/t an operational variable or evaluate using a spreadsheet:
Per Sharda et al. (2014), the balanced scorecard approach to performance management was developed in 1992 by Kaplan and Norton. They quote: "Central to the BSC methodology is a holistic vision of a measurement system tied to the strategic direction of the organization. It is based on a four-perspective view of the [business] world" (p. 132), in which the "nonfinancial objectives [perspectives] form a simple causal chain [or ***strategy map]*** with 'learning and growth' driving 'internal business process' change, which produces 'customer' outcomes that are responsible for reaching a company's financial objectives" (p. 134). 'Balance' is sought in multiple dimensions:
"[C]ustomer focus and customer satisfaction ... [t]hese are leading indicators ... [and] in developing metrics for satisfaction, customers should be analyzed in terms of kinds of customers and the kinds of processes for which we are providing a product or service to those customer groups" (Sharda et al., 2014, p. 133).
The financial perspective does not need much advocacy or clarification. It is the domain of corporate finance and accounting; is subject to regulation and shareholder oversight; and includes many well-established metrics---although, Sharda et al. suggest---"there is perhaps a need to include additional financial-related data, such as risk assessment and cost-benefit data, in this category" (2014, p. 133).
This "includes employee training, knowledge management, and corporate cultural characteristics related to both individual and corporate-level improvement ... it also includes things like mentors and tutors within the organization, as well as that ease of communication among workers that allows them to readily get help on a problem when it is needed" (Sharda et al., 2014, p. 133).
Measuring and managing "processes the organization must excel at in order to satisfy its shareholders and customers" (Sharda et al., 2014, p. 134).
"In the quality arena, variability [denoted by sigma] is synonymous with the number of defects"; while its original application is to process improvement , Six Sigma [can be] a performance management methodology aimed at reducing the number of defects in a business process to as close to zero DPMO [defects per million opportunities] as possible."
For existing processes, Six Sigma rests on a DMAIC closed-loop model, similar to the BPM model (Sharda et al., 2014, p. 136):
| Define | Measure | Analyze | Improve | Control |
|---|---|---|---|---|
| Define the goals, objectives, and boundaries of the improvement activity. At the top level, the goals are the strategic objectives of the company. At lower levels---department or project levels---the goals are focused on specific operational processes. | Measure the existing system. Establish quantitative measures that will yield statistically valid data. The data can be used to monitor progress toward the goals defined in the previous step. | Analyze the system to identify ways to eliminate the gap between the current performance of the system or process and the desired goal. | Initiate actions to eliminate the gap by finding ways to do things better, cheaper, or faster. Use project management and other planning tools to implement the new approach. | Institutionalize the improved system by modifying compensation and incentive systems, policies, procedures, manufacturing resource planning, budgets, operation instructions, or other management systems. |
For creation of new processes, the model is DMADV (define, measure, analyze, design, verify).
Per Dennis et al. (2012),
| * | Business Process Automation | Business Process Improvement | Business Process Reengineering |
|---|---|---|---|
| Potential business value | Low-moderate | Moderate | High |
| Project cost | Low | Low-moderate | High |
| Breadth of analysis | Narrow | Narrow-moderate | Very broad |
| Risk | Low-moderate | Low-moderate | Very high |
BPA is focused on making current processes more efficient through automation; it requires thorough analysis of the current system.
This entails asking current system users about problems they face or features they desire. Problems identified with this technique are often related to UI and their resolution produces little if any business value.
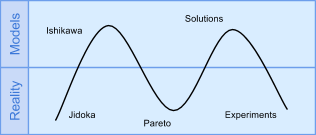
This entails asking current system users to explore the root causes of problems they've identified (since these problems may only be symptoms). Root causes may be uncovered by asking "Why?" five times; causal relationships may be represented as a hierarchy, web, or fishbone/Ishikawa diagram.
BPI goes beyond increased efficiency to the realm of increased effectiveness, for instance taking advantage of new opportunities and technologies.
First, major processes are timed; second, all individual steps in those processes are timed. If the sum of step durations is smaller than the overall duration, this indicates a need for improvement --- which may be achieved through integration (fewer people involved in doing the work across its lifecycle) or parallelization (steps being done concurrently).
Steps in a process are costed, and improvement efforts are focused on the costliest step.
Examine competitors to identify performance targets and process improvements.
BPR is a radical upending of current business processes and systems, so spends little time analyzing them. Per Rigby (2015; also gives recommendations for further reading), a BPR effort focuses on:
Trying to think about the business from the perspective of users' ultimate goals and needs (recognizing that your product or service may be only a means to an end).
Reviewing existing and emerging technologies and asking how they might be applied in your company (either as a process improvement or a product).
Systematically (but as a thought exercise) eliminating each step in a process, and asking what the implications are.
These notes are based on Jeevon Powell's class, Process Improvement Tools.
See notes on systems modeling.
These notes are based on Christian Terwiesch's Coursera class, Intro. to Operations Management.
Business processes underlie performance. One way to measure them: graph flow units vs. time, showing cumulative inflow and cumulative outflow. Then:
Create a process flow diagram aka value stream map showing how flow units are transformed from inputs to outputs by process activities. Represent wait times, lines, or inventories with triangles, and activities with boxes (labeled with activity time in units, and m, the number of workers or resources). Then:
Realistically, processing times will vary from flow unit to flow unit. Flow units may even follow different pathways through all possible process activities. So, how to find the bottleneck and determine the flow rate? Depict multiple flow units on same process diagram, symbolized as types of flow units, then:
Why focus on this when labor seems to contribute less to modern firms’ costs? —because many firms keep labor costs off their balance sheet by ‘outsourcing’ them to their suppliers. If you account for labor in the cost of goods supplied, the role of labor becomes evident.
Inventory=Flow_rate*Flow_time. Given any two variables, can solve for a third (especially flow time); also, can decide how to manipulate outcomes by adjusting a variable. Note that flow time here is essentially average flow time, a line fitted to the actual data recorded from observations of inflow and outflow. “Not an empirical law; to prove it, we need to turn to stochastic optimization.”
Cost_Of_Goods_Sold/Inventory. Gives the amount of time that a flow unit spends inside the process; comes from Little’s law (where COGS=Flow_rate). High inventory turns can dramatically reduce inventory costs (capital, storage, obsolescence). Per unit inventory costs=Annual_inventory_cost/Inventory_turns.
Motivating question here is why should there be inventory? What are the drivers of inventory? (Note that, per Little’s law, these same factors are implicit drivers of flow time.) Contrast McDonald’s and Subway—not all companies use inventory to increase flow rate; there are make-to-stock vs. make-to-order strategies.
Frederick Winslow Taylor (1911), Principles of Scientific Management. . In general, (multifactor) productivity is a ratio of output_produced / input(s)_used.
Improving a process by reducing internal variability.
Help distinguish between normal and abnormal variation; part of statistical process control
Detect → Alert → Stop, as quickly as possible, to prevent defects from reaching the bottleneck. In manufacturing assembly lines, jidoka is often implemented with andon cords (for workers to pull, freezing the whole line) and a central andon board (to indicate which station initiated the stop).
Looking for root cause(s):

Dennis, A., Haley Wixom, B., & Tegarden, D. (2012). Requirements determination. In Systems analysis and design: An object oriented approach with UML (4th ed., pp. 109–152). Hoboken, NJ: Wiley.
Jones, G. R. & George, J. M. (2015). Contemporary management (9th ed.). Colombus, OH: McGraw-Hill Education.
Rigby, D. K. (2015). Management tools 2015: An executive’s guide. Boston, MA: Bain & Company.
Sharda, R., Delen, D., & Turban, E. (2014). Business intelligence: A managerial perspective on analytics (3rd ed.). New York City, NY: Pearson.
Terwiesch, C. (n.d.) Introduction to Operations Management [online class]. Coursera. Retrieved from https://www.coursera.org/learn/wharton-operations