pkb contents
> bi | just under 3693 words | updated 12/30/2017
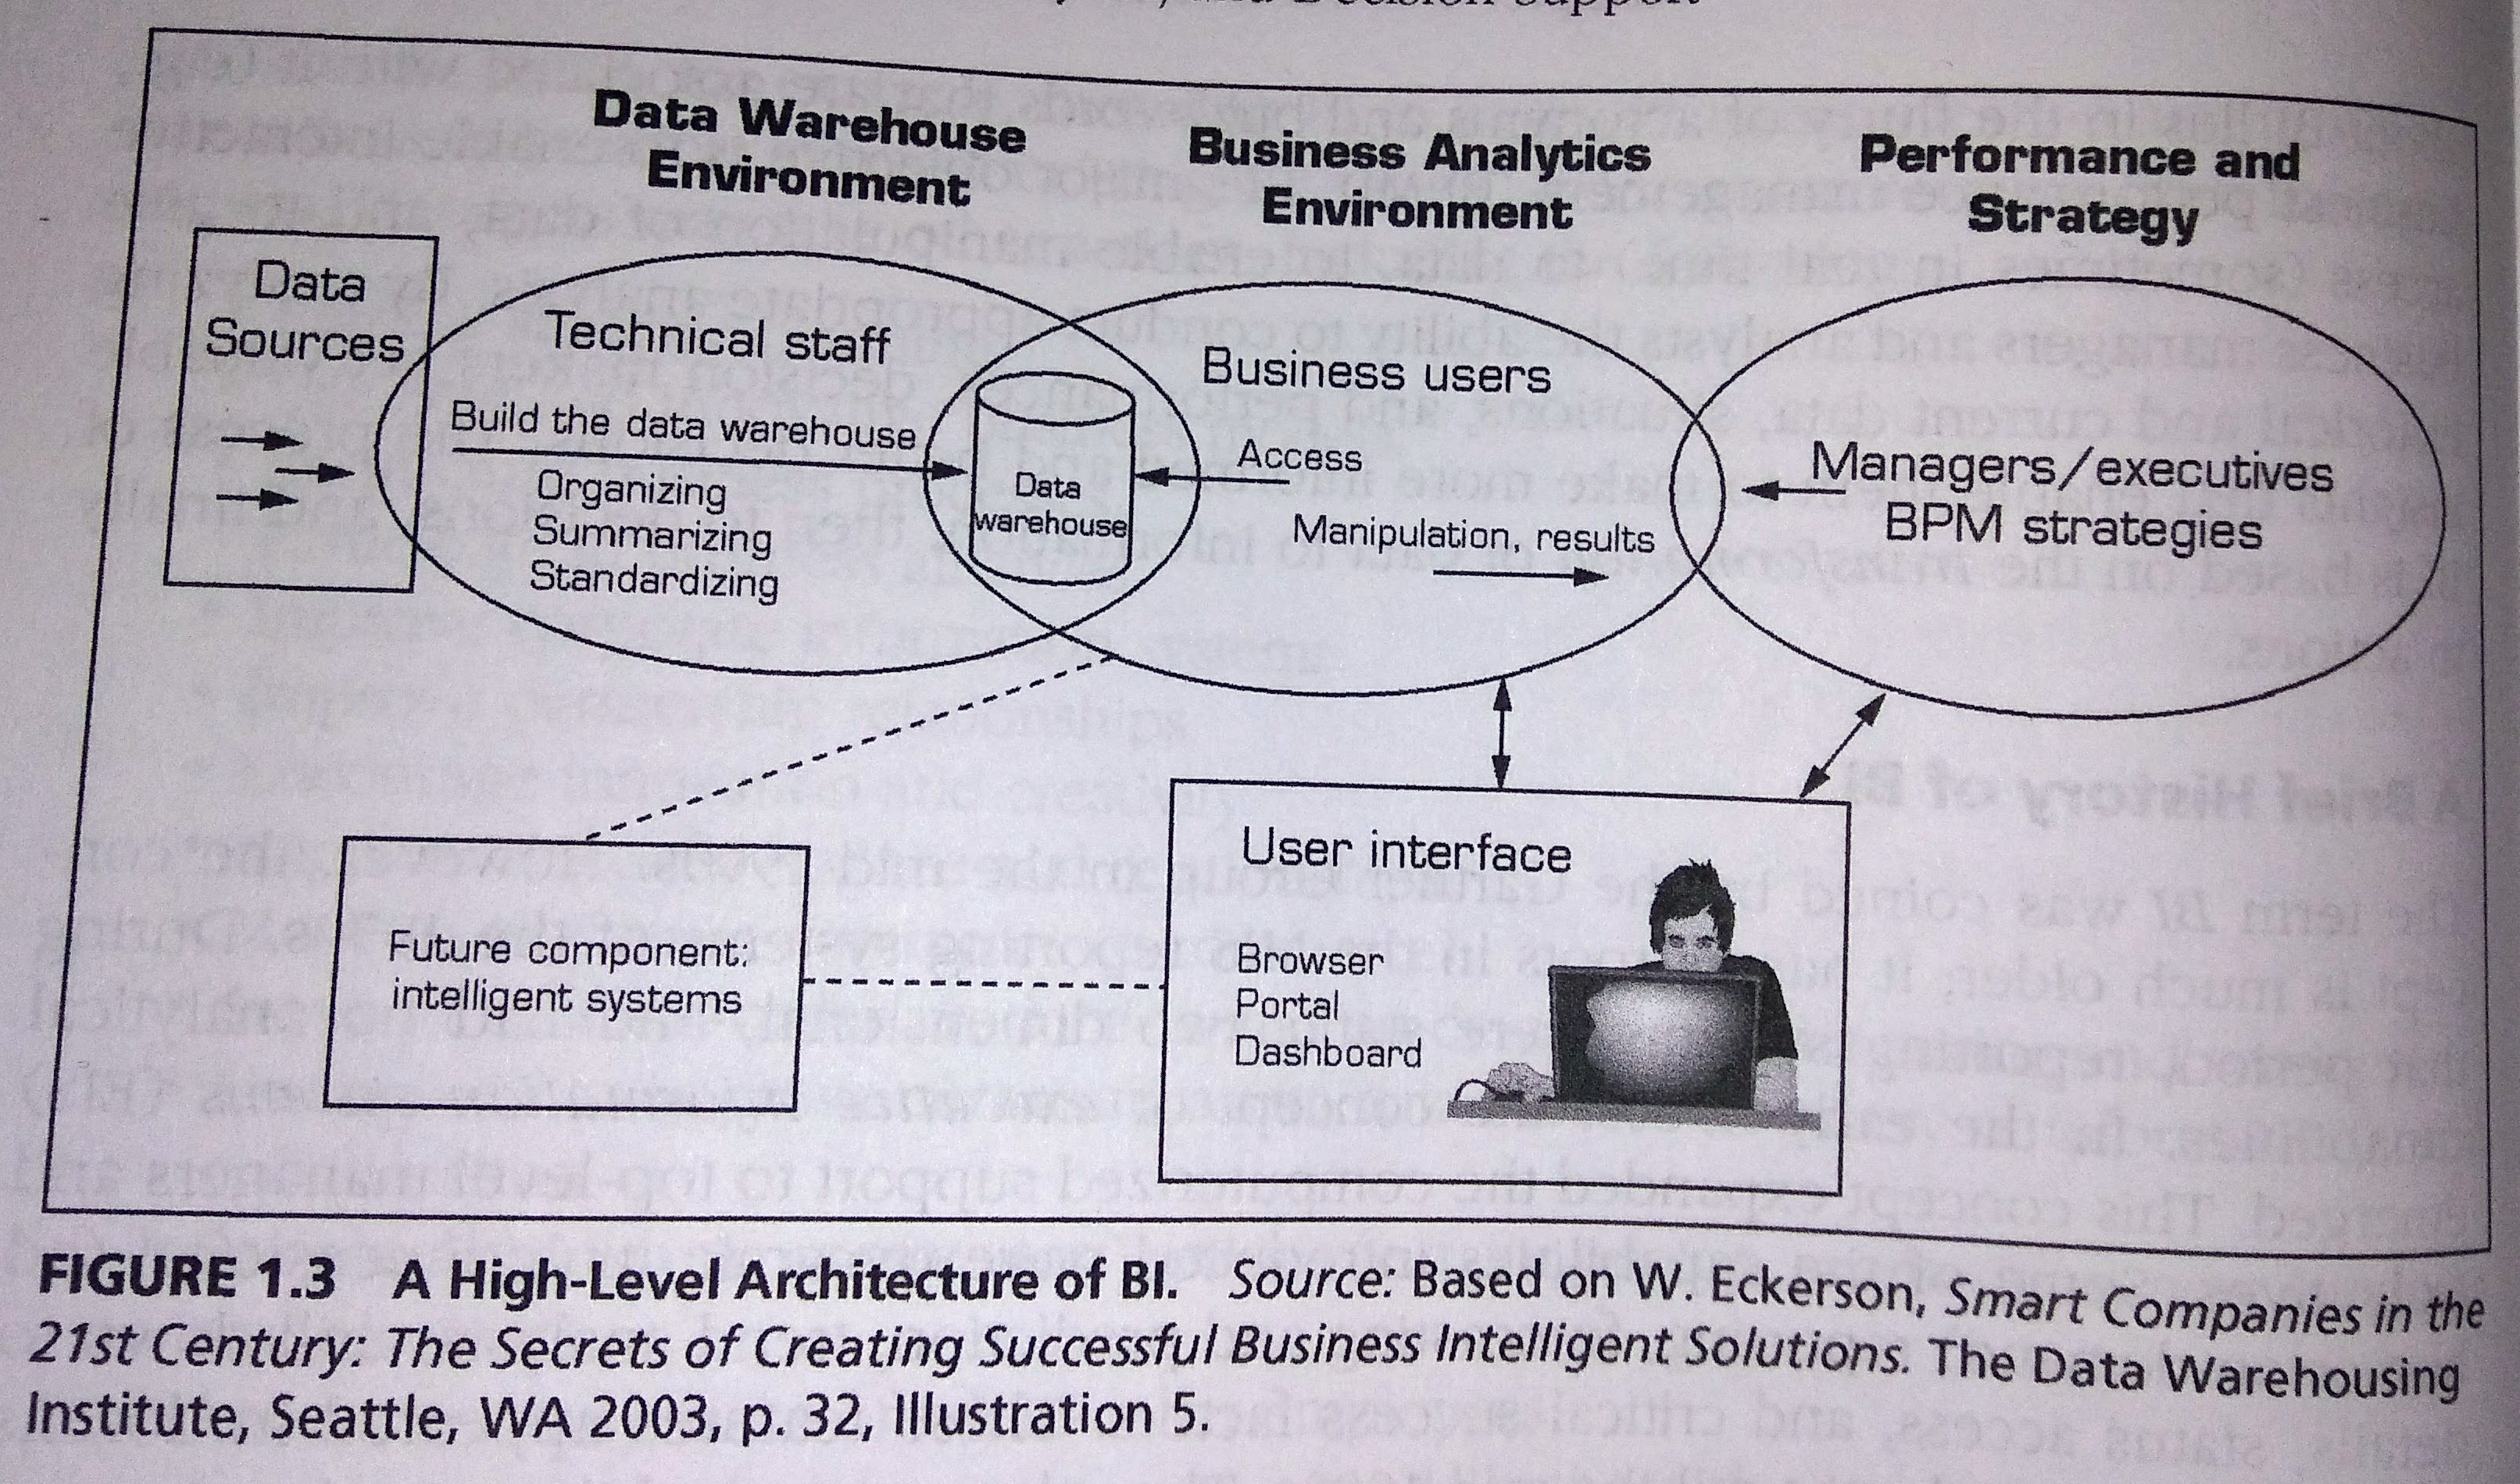
Business intelligence (BI) systems are a type of
management information system (MIS)
that supports managerial (strategic and operational) decision-making. Sharda et al. (2014) offer the “business pressures-responses-support” model of BI, in which:
-
The business environment supplies pressures and opportunities (see
PESTEL analysis
and
management notes);
-
Managers need to respond (different possibilities, Sharda et al. [2014, p. 7]: "reactive, anticipative, adaptive, and proactive");
-
BI supports their response/decision with analysis and predictions.
In theory, BI adds value by improving decisions. BI may enable organizations to answer their questions faster, or to pose new questions and gain new insights. Faster answers may support faster actions; new insights may indicate and/or support new courses of action. But very clearly, the value of BI depends on (1) the
quality of the data
being fed into the system; (2) the
quality of the analysis
performed on the data; (3) the
capacity to turn analysis into decisions,
and most fundamentally, (4) the
capacity to act on decisions.
(Senge's concept of a learning organization is relevant here---it is an organization that can
not only
make and act on decisions, but also reflect on outcomes and improve them through iteration.)
-
[use of info to support decisions]
-
[use of computers to support decisions]
-
Executive and management information systems
-
BI systems enabling broader access to data, closer to ground-level where people can base their actions on it

Per Sharda et al. (2014):
-
Location-based analytics
-
Geospatial analytics
-
Real-time location intelligence
-
Analytics for consumers
-
Recommendation engines
-
Web 2.0
-
Cloud-computing
-
Ethics in decision-making
-
Privacy impacts of BI
Also:
Per Sharda et al. (2004), BI tools provide varying combinations of the following broad functionalities:
-
data storage
-
data management
-
business performance management
-
UI
Gartner's Magic Quadrant for BI and Analytics Platforms (Sallam et al., 2017) compares software across the following capabilities:
-
"Infrastructure
-
BI Platform Administration, Security and Architecture.
Capabilities that enable platform security, administering users, auditing platform access and utilization, optimizing performance and ensuring high availability and disaster recovery.
-
Cloud BI.
Platform-as-a-service and analytic-application-as-a-service capabilities for building, deploying and managing analytics and analytic applications in the cloud, based on data both in the cloud and on-premises.
-
Data Source Connectivity and Ingestion.
Capabilities that allow users to connect to structured and unstructured data contained within various types of storage platforms, both on-premises and in the cloud.
-
Data Management
-
Metadata Management.
Tools for enabling users to leverage a common SOR semantic model and metadata. These should provide a robust and centralized way for administrators to search, capture, store, reuse and publish metadata objects such as dimensions, hierarchies, measures, performance metrics/key performance indicators (KPIs), and report layout objects, parameters and so on. Administrators should have the ability to promote a business-user defined data mashup and metadata to the SOR metadata.
-
Self-Contained Extraction, Transformation and Loading (ETL) and Data Storage.
Platform capabilities for accessing, integrating, transforming and loading data into a self-contained performance engine, with the ability to index data and manage data loads and refresh scheduling.
-
Self-Service Data Preparation.
"Drag and drop" user-driven data combination of different sources, and the creation of analytic models such as user-defined measures, sets, groups and hierarchies. Advanced capabilities include machine-learning-enabled semantic autodiscovery, intelligent joins, intelligent profiling, hierarchy generation, data lineage and data blending on varied data sources, including multistructured data.
-
Analysis and Content Creation
-
Embedded Advanced Analytics.
Enables users to easily access advanced analytics capabilities that are self-contained within the platform itself or through the import and integration of externally developed models.
-
Analytic Dashboards. The ability to create highly interactive dashboards and content with visual exploration and embedded advanced and geospatial analytics to be consumed by others
-
Interactive Visual Exploration.
Enables the exploration of data via an array of visualization options that go beyond those of basic pie, bar and line charts to include heat and tree maps, geographic maps, scatter plots and other special-purpose visuals. These tools enable users to analyze and manipulate the data by interacting directly with a visual representation of it to display as percentages, bins and groups.
-
Smart Data Discovery.
Automatically finds, visualizes and narrates important findings such as correlations, exceptions, clusters, links and predictions in data that are relevant to users without requiring them to build models or write algorithms. Users explore data via visualizations, natural-language-generated narration, search and NLQ technologies.
-
Mobile Exploration and Authoring.
Enables organizations to develop and deliver content to mobile devices in a publishing and/or interactive mode, and takes advantage of mobile devices' native capabilities, such as touchscreen, camera and location awareness.
-
Sharing of Findings
-
Embedding Analytic Content.
Capabilities including a software developer's kit with APIs and support for open standards for creating and modifying analytic content, visualizations and applications, embedding them into a business process and/or an application or portal. These capabilities can reside outside the application, reusing the analytic infrastructure, but must be easily and seamlessly accessible from inside the application without forcing users to switch between systems. The capabilities for integrating BI and analytics with the application architecture will enable users to choose where in the business process the analytics should be embedded.
-
Publish, Share and Collaborate on Analytic Content.
Capabilities that allow users to publish, deploy and operationalize analytic content through various output types and distribution methods, with support for content search, scheduling and alerts. Enables users to share, discuss and track information, analysis, analytic content and decisions via discussion threads, chat and annotations.
-
Overall platform capabilities
-
Platform Capabilities and Workflow.
This capability considers the degree to which capabilities are offered in a single, seamless product or across multiple products with little integration.
-
Ease of Use and Visual Appeal.
Ease of use to administer and deploy the platform, create content, consume and interact with content, as well as the visual appeal."
Per Sharda et al. (2014, pp. 73-74):
-
"Starting with the wrong sponsorship chain
-
... or offending sponsors by implying deficiencies in their decision-making
-
Setting expectations that you cannot meet
-
Loading the warehouse with information just because it is available
-
Believing that data warehouse database design is the same as transactional database design
-
Choosing a data warehouse manager who is technology oriented rather than user oriented
-
Focusing on traditional internal record-oriented data and ignoring the value of external data and of text, images, and, perhaps, sound and video
-
Delivering data with overlapping and confusing definitions
-
Believing promises of performance, capacity, and scalability [w/r/t BI software purchases]
-
Believing that your problems are over when the data warehouse is up and running
-
Focusing on ad hoc data mining and periodic reporting instead of alerts"
A Big Data maturity model, per Zhu et al. (2014, p. 26):
The Data Warehousing Institute (TDWI) also has
maturity models
for:
-
Self-service analytics
-
IoT readiness
-
Hadoop readiness
-
Analytics maturity
See
notes on big data.
Per Sharda et al. (2014, p. 81):
|
Strategic decisions only
|
Strategic and tactical decisions
|
|
Results sometimes hard to measure
|
Results measured with operations
|
|
Daily, weekly, monthly data currency acceptable; summaries often appropriate
|
Only comprehensive detailed data available within minutes is acceptable
|
|
Moderate user concurrency
|
High number (1000 or more) of users accessing and querying the system simultaneously
|
|
Highly restrictive reporting used to confirm or check existing processes and patterns; often uses predeveloped summary tables or data marts
|
Flexible ad hoc reporting, as well as machine-assisted modeling (e.g., data mining) to discover new hypotheses and relationships
|
|
Power users, knowledge workers, internal users
|
Operational staffs, call centers, external users
|
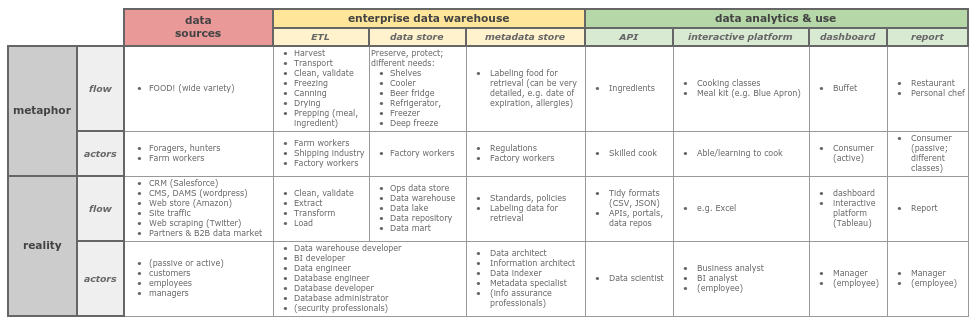
Data must be
extracted
from operational systems;
transformed
so that it is clean, conformant with data quality standards, and aligned with the logical structure of the data warehouse; and finally
loaded
into the data warehouse. Per Sharda et al. (2014), important factors to consider in selecting ETL tools:
-
Integration with data sources
-
Automatic metadata capture
-
Conformance with open standards
-
Easy-to-use interfaces for developers and users
A data warehouse is a data store that is used to
-
free up resources by removing data from operational systems;
-
create a trustworthy, safe, and persistent archive of data;
-
clean and aggregate data so that it can be easily analyzed.
Per Sharda et al., many data warehouses have the following characteristics:
-
Subject-oriented
(i.e., conceptually curated)
-
Integrated
(combining data across operational systems)
-
Time variant
(storing data in a way that allows time series analysis)
-
Nonvolatile
(protected from edits)
Per Sharda et al. (2014, p. 47):
-
Reduced infrastructure expense
-
Better compliance
-
Easier for IT/IS to be maintained
-
Reduced warranty expense
-
Improved quality (identifying and prioritizing issues faster)
-
Combines data, enabling construction of a more accurate and comprehensive picture of the organization
Dimensional modeling is data modeling to optimize retrieval (read rather than write).
Star schema
(denormalized) and
snowflake schema
(normalized) are common.
-
(In)dependent data mart:
A data mart serves a single department or focuses on a single area; it is conceptually confined. If dependent, the data mart is a subset of a broader data warehouse.
-
Data mart bus architecture:
Dimensionalized data marts linked by conformed dimensions (Ralph Kimball: "plan big, build small").
-
Hub-and-spoke architecture:
Normalized relational data warehouse, serving dependent data marts (Bill Inmon; top-down approach).
-
Centralized data warehouse:
As above.
-
Federated data warehouse:
Existing data warehouses, marts and legacy systems are mapped together and/or physically integrated.
-
Operational data store:
An ODS has fresh data, to support immediate and short-term decision-making. It does not fulfill the traditional DW's role of storing data and enabling analysis across long periods of time.
-
Oper marts:
ODS for multidimensional analysis.
Per Sharda et al. (2014):
-
Which database management system (DBMS) should be used? Should it be relational?
-
For scalability and speed, will parallel processing be required? Will tables need to be partitioned?
-
How much data should be migrated into the new DW, and will this require special tools?
-
What additional tools or integrations will be needed to support data retrieval?
-
What additional tools or integrations will be needed to support data analysis?
More factors, from Ariyachandra and Watson (2005) qtd in Sharda et al. (2014, p. 55):
-
Information interdependence between organizational units
-
Upper management's information needs
-
Nature of end-user tasks
-
Constraints on reqources
-
Compatability with existing systems
-
Perceived ability/capacity of in-house IT staff
Per Sharda et al. (2014, pp. 304-305):
-
basic indexing
-
advanced indexing
-
materialized views
-
aggregate join indexes
-
cube indexes
-
spares join indexes
-
cost-based optimizer (analyzing SQL query, generates alternatives, compares cost)
-
partitioning
"Simply, OLAP is an approach to quickly answer ad hoc questions by executing multidimensional analytic queries against organizational data repositories" (Sharda et al., 2014, p. 69). The disctinction between
transaction
and analytics databases arises from the current state of computer science, viz., you must optimize for either reads or writes. In addition to this basic distinction, there are
subtypes of OLAP databases
(HTAP, MOLAP, ROLAP, etc.) with varying functionality.
|
OLTP
|
operational database
|
captures each record: emails, credit card transactions, webpage views, …
|
efficiency, control
|
|
OLAP
|
data warehouse
|
ops --> data warehouse --> OLAP --> UI/dashboard
|
aggregation, efficiency, accuracy, access
|
To enable OLAP, data is stored in multidimensional cubes. These cubes can be efficiently
sliced
on a single dimension or
diced
on several; a user can
drill down
or up for different levels of detail; a user can
roll-up
a dimension, running calculations on it and its relationships; and a user may
pivot
to "change the dimensional orientation of a report or ad hoc query-display page" (Sharda et al., 2014, p. 71).
BA is a field, and its practitioners---business analysts---are perhaps the frontline users of data from BI systems; they play a major role in translating this data into action by relating it back to business processes and decisions.
BABOK
is the gold standard description of BA skills, but Brandenberg (n.d.) offers the following short version:
-
CORE SKILLS
-
Communication skills
-
Writing & face-to-face communication
-
Listening & asking good questions
-
Problem-solving skills
-
Critical-thinking skills
-
ADVANCED SOFT SKILLS
-
Relationship-building
for stakeholder participation and appeal
-
Self-management
-
Thick skin
for participatory design work
-
CORE BA SKILLS
-
Facilitation & elicitation
as part of the design process
-
Analysis of:
-
"how the
business
work flows operationally, often completed by analyzing the business process";
-
"how the
software system
supports the business workflows, often completed through functional requirements models like use cases or user stories";
-
"how
data and information
is stored and maintained by an organization, completed using a variety of data modeling techniques"
-
Documentation, specification, and visual modeling
-
Business analysis tools
e.g.
-
Office
- Word, Excel, PowerPoint
-
Modeling
- Visio, Enterprise Architect
-
Requirements Management
- DOORS, Caliber
-
Project Management
-
Quality Management
-
ADVANCED BA SKILLS
-
Technical
e.g. SQL, .NET, Perl, Python, etc.
-
Methodology
e.g. Agile, Six Sigma, BPMN, Rational Unified Process, etc.
-
Industry/Domain
(see
notes on data science
for an overview of data science skills)
Versus BI and BA:
-
DS involves more programming, is better at using computational power for analysis
-
DS may involve more sophisticated modeling, facilitating more predictive and prescriptive analytics
-
Because DS uses computers, it loses the context awareness that human actors supply in their interactions with BI and must recreate it somehow (for instance in training machine learning algorithms)
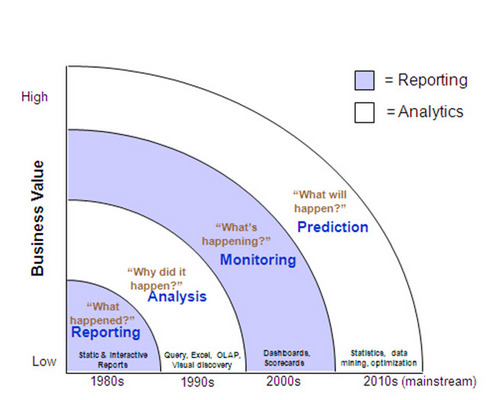
Per Sharda et al. (2014):
-
Descriptive:
Asking what happened or is happening to generate well-defined business problems and opportunities; also provides answers to simple questions
-
Predictive:
Asking what’s going to happen and why, to generate accurate projections that can inform analyses
-
Prescriptive:
Asking what should be done and generating (or even executing) a specific solution
According to Sharda et al. (2014) and
summarized here,
SAS published a white paper describing different "levels" of analytics:
|
Standard Reporting
|
-
Historical perspective
-
Standard KPI or data parameters
-
Focused on short-term goals and objectives
|
|
Customized Reporting
|
-
Flexible reporting
-
Focused on problem solving
-
Historical perspective
|
|
Drill down analysis
|
-
Root cause analysis
-
Stratification analysis
-
Used exensively in
DMAIC processes
|
|
Alerts & Notifications
|
-
Management by exception
-
Pre-defined business process
-
Real-time feedback
|
|
Statistical Analysis
|
-
Correlation analysis
-
Discriminant analysis
-
Regression analysis
|
|
Forecasting
|
-
Trends
-
Pattern recognition
-
Decision-making capability
|
|
Predictive Modeling
|
-
Prognostics
-
Data-driven decisions
|
|
Optimization
|
-
Enable innovation
-
Continuous improvement
-
Adaptive feedback
|
Business performance management (BPM) entails measuring and improving
actual performance
versus KPIs and goals that have been established in correspondance with
managerial strategy
or local appetite; see
notes on performance management
for further discussion. BPM intersects with BI because it is one of the primary intended uses of BI data---to understand and improve operations. The content of BI dashboards may be stongly determined by performance management goals and techniques.
See
notes on data mining
for discussion of the business applications and implementation of prediction, association, and clustering techniques.
See
notes on text analytics.
Per Sharda et al. (2014, pp. 114-116),
data visualization
is increasingly important capability of BI software because it makes meaning in the data more accessible to more users---and
visual analytics
is a new term meant to describe data viz that goes beyond description to the realm of business analytics, i.e. "diagnostic ... prescriptive and predictive". See
notes on data visualization
regarding the conversion of data into informative visuals; see
notes on dashboard design
regarding the presentation of multiple data visuals, combined to facilitate insights.
Sharda et al. call reporting "an essential part of the larger drive toward improved managerial decision making and
organizational knowledge management"
and credit it with serving multiple
internal functions:
-
"To ensure that all departments are functioning properly
-
To provide information
-
To provide the results of an analysis
-
To persuade others to act
-
To create an organizational memory"
Per Sharda et al. (2014, pp. 99-100), a report is "any communication artifact prepared with the specific intention of conveying information in a presentable form to whoever needs it"---which, in a business context, includes "memos, minutes, lab reports, sales reports, progress reports, justification reports, compliance reports, annual reports, and policies and procedures" (I object to the inclusion of policies and procedures in this list, because I would call them
documentation).
Reports can be for internal or external audiences, and prepared on a periodic or ad hoc basis. Regarding external reporting, the Data Foundation's
Standard Business Reporting
effort is an attempt to reduce reporting costs by standardizing national and international governmental reporting requirements.
|
Informal
|
...
|
< 10 pgs.
|
Periodic/routine
|
Internal
|
Personal pronouns & contractions OK
|
|
Formal
|
Communicate results of deeper research/analysis
|
10-100 pgs.
|
...
|
Varies
|
Formal language; table of contents, executive summary
|
|
Short
|
"investigative, compliance, and situational focused"
|
(short)
|
Often periodic
|
Varies
|
Factual
|
Sharda et al. (2014) cite Hill's (2013) typology of business reports:
-
Metric management reports
that track performance versus
SLAs
(service-level agreements with external partners) or
KPIs
(key performance indicators for internal strategic and operational targets); often used with Six Sigma or Total Quality Management (TQM)
-
Balanced scorecard-type reports
from Kaplan and Norton, adding "customer, business process, and learning and growth perspectives" alongside financial performance
-
Dashboard-type reports:
arrange multiple performance indicators as a dashboard
See
notes on dashboard design.
-
Per Sharda et al. (2014, p. 100): "clarity, brevity, completeness, and correctness"
-
Sharda et al. cite Hill (2008) on the importance of "an overarching
assurance
process that covers the entire value chain and moves back and forth, enrusing that reporting requirements and information delivery are properly aligned"
-
See
notes on graphic design
re: layout
From Sharda et al. (2014, p. 117), to present data as a story, ask:
"Who are the
characters?
What is the drama or
challenge?
What hurdles have to be overcome? And at the end of your story, what do you want your audience to
do
as a result?
(connect your 'call to action' with existing managerial conversations, if possible). They also cite Fink and Moore (2012):
-
"Think of your analysis as a story---use a story structure.
-
Be authentic---your story will flow.
-
Be visual---think of yourself as a film editor.
-
Make it easy for your audience and you.
-
Invite and direct discussion."
Brandenberg, L. (n.d.) What Business Analyst skills are important for a new BA? Retrieved from
http://www.bridging-the-gap.com/business-analyst-skills-important/
Fink, E., & Moore, S. J. (2012). Five best practices for telling great stories with data. Tableau Software, Inc. Retrieved from
http://tableausoftware.com/whitepapers/telling-stories-with-data
Sallam, R, L., Howson, C., Idoine, C. J., Oestreich, T. W., & Laurence, J. (2017). Magic Quadrant for Business Intelligence and Analytics Platforms. Gartner. Retrieved from
https://cdn2.hubspot.net/hubfs/2172371/Q1%202017%20Gartner.pdf?t=149626062
Sharda, R., Delen, D., & Turban, E. (2014).
Business intelligence: A managerial perspective on analytics
(3rd ed.). New York City, NY: Pearson.